
 Новости
 Фотогалерея
 Клубы
Клубы Каталог
 Оставить отзыв
 Пользователи
 Объявления
 Хостинг
 Технический анализ
 Конкурсы фото
 ПОЛНЫЙ СПИСОК
 Блоги
Блоги
 |
 |
Analisis With Candle Engulfing determinant Страница - 9
 Сообщений: 239 |
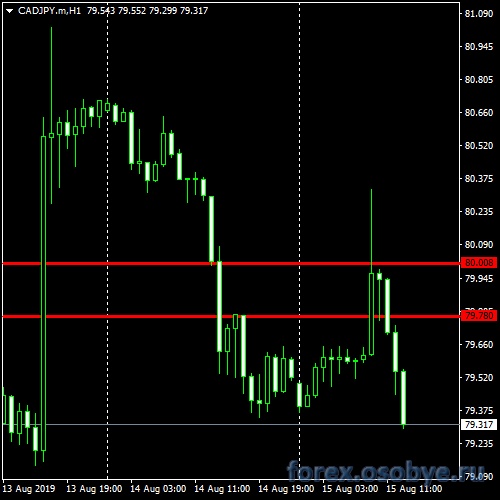
August 15, 2019, when viewed on the chart CADJPY time frame H1, for the next 24 hours I have made a horizontal line at the price of 80.00 and 79.78 based on the candle I chose, I will focus on buying if above 80.00 and sell if the price is below 79.78 for the next 24 hour analysis period | ||
Сообщений: 239 |
August 15, 2019, when viewed on the chart EURAUD time frame H1, for the next 24 hours I have made a horizontal line at the price of 1.6482 and 1.6452 based on the candle I chose, I will focus on buying if above 1.6482 and sell if the price is below 1.6452 for the next 24 hour analysis period  | ||
Сообщений: 239 |
August 15, 2019, when viewed on the chart NZDUSD time frame H1, for the next 24 hours I have made a horizontal line at the price of 0.6443 and 0.6423 based on the candle I chose, I will focus on buying if above 0.6443 and sell if the price is below 0.6423 for the next 24 hour analysis period 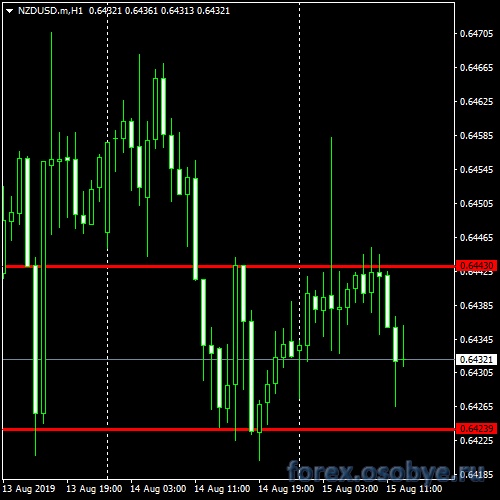 | ||
Сообщений: 239 |
August 15, 2019, when viewed on the chart EURGBP time frame H1, for the next 24 hours I have made a horizontal line at the price of 0.9250 and 0.9208 based on the candle I chose, I will focus on buying if above 0.9250 and sell if the price is below 0.9208 for the next 24 hour analysis period  | ||
Сообщений: 239 |
19 August 2019, Good evening, again this time I want to analyze the movement of the EURUSD pair at the H1 timeframe. As usual I used two horizontal lines and then made an area that was colored blue (see picture) for my open position reference, at Prices are 1.1110 and 1.1098. the blue area is a good area for me to open short positions. with stop losses above the price of 1.1110 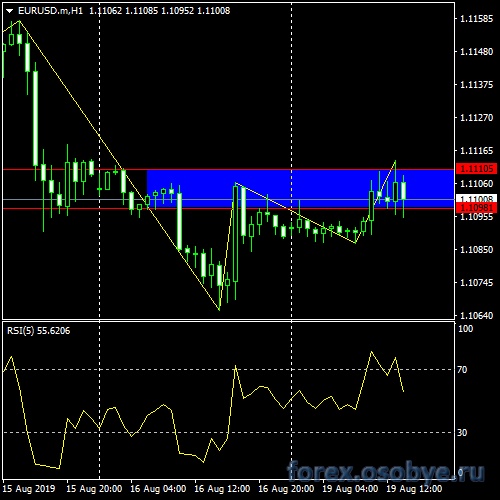 | ||
Сообщений: 239 |
August 19, 2019, The following market analysis in the American open market session, this time I want to analyze the movement of the GBPUSD pair in the H1 period. I still use two horizontal lines and then make a blue area (see picture) to reference my open position, with prices 1.2119 and 1.2105. the blue area is a good area for me to open long positions. with stop losses below the price of 1.2105 around 30-40pips 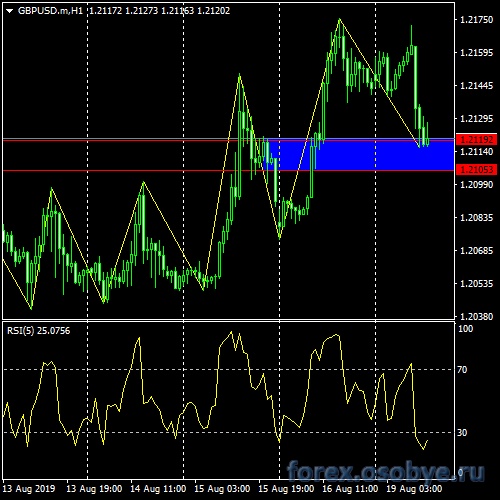 | ||
Сообщений: 239 |
August 19, 2019, following the analysis in the American open market session, I would like to analyze the movement of the USDJPY pair in the H1 period. as before using two horizontal lines then made a blue area (see picture) to reference my open position, with prices 106.60 and 106.38. in the blue area is the area to open positions. This time I focus more on opening short positions with stop losses above 106.60 around 20-40pips  | ||
Сообщений: 239 |
August 19, 2019, This time an analysis of the American open market session, the USDCHF currency pair in the H1 period. keep using two horizontal lines then I make the area colored blue (see picture) to reference my open position whether to sell or buy, with Prices 0.9806 and 0.9789. in the blue area is the area to open positions. Next time I focus I prefer to open short positions 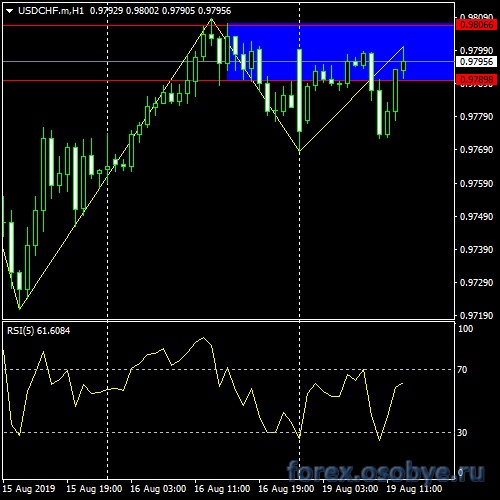 | ||
Сообщений: 239 |
19 August 2019, Hello friends, again this time I want to analyze the movement of the AUDUSD pair on the H1 timeframe, using two horizontal lines and then making an area that is colored blue (see picture) to reference my open positions either sell or buy, there at Prices 0.6790 and 0.6778. the blue area becomes the area for open positions. this time I will focus on selling if viewed based on the blue area  | ||
Сообщений: 239 |
August 19, 2019, the next market in the American open market session, this time I want to analyze the movement of the USDCAD pair at the H1 period. I used two horizontal lines and then made a blue area (see picture) to reference my open position, with prices 1.3303 and 1.3288. the blue area is a good area for me to open Sell positions, but now the price is too below the blue area, then I will make a pending order Sell limit in the blue area 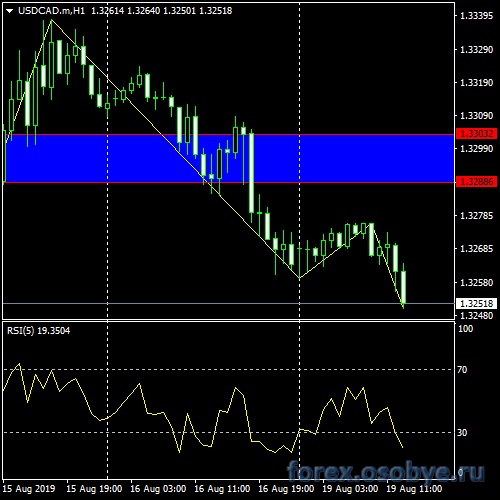 | ||
Сообщений: 239 |
August 19, 2019, the next market in the American open market session, this time I want to analyze the movement of the EURJPY pair in the H1 period. I used two horizontal lines and then made a blue area (see picture) to reference my open position, with Prices 118.55 and 118.31. the blue area is a good area for me to open a Sell position, with stop losses of around 10-30pips only  | ||
Сообщений: 239 |
August 19, 2019, the next market in the American open market session, this time I want to analyze the movement of the GBPJPY pair during the H1 period. I used two horizontal lines and then made a blue area (see picture) to reference my open position, with Prices 128.62 and 128.20. the blue area is a good area for me to open Buy positions, but now the price is now too above the blue area, then I will make a pending order Buy limit in the blue area with a stop loss of 20-40pips 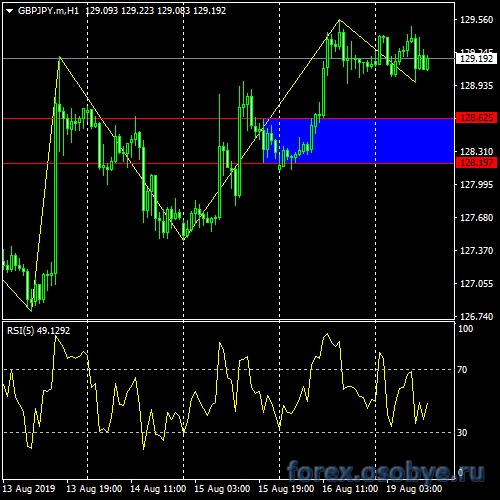 | ||
Сообщений: 239 |
August 19, 2019, Hello friend, this time I want to analyze the movements of the AUDCAD currency pair on the H1 timeframe. As usual I use two horizontal lines and then make an area that is colored blue (see picture) for my open position reference, at the price 0.8990 and 0.8971. If you see the picture that I uploaded, the price is now in the blue area, making it a good area for me to open a buy position  | ||
Сообщений: 239 |
August 19, 2019, the next market in the American open market session, this time I want to analyze the movement of the XAUUSD pair in the H1 period. I used two horizontal lines and then made a blue area (see picture) to reference my open position, with prices 1502.37 and 1496.93. the blue area is a good area for me to open Buy positions, with stop losses of 20-50pips, if the price breaks through 1496.93 then I try to open short positions 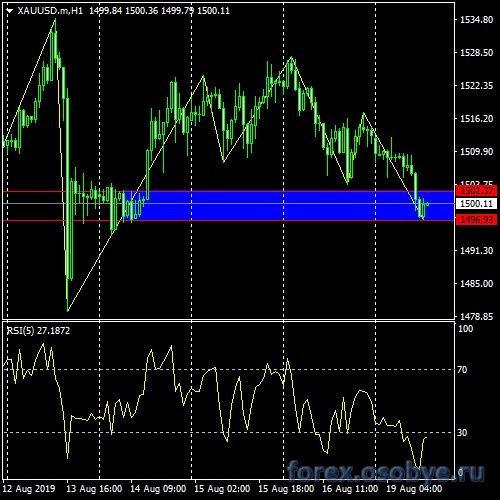 | ||
Сообщений: 239 |
August 19, 2019, This time the analysis of the American open market session, on the AUDJPY currency pair in the H1 period. keep using two horizontal lines then I made the area in blue (see picture) to reference my open position whether to sell or buy, with Prices 72.16 and 72.00. in the blue area is the area to open the best position in my opinion. this time my focus is to choose an open buy position 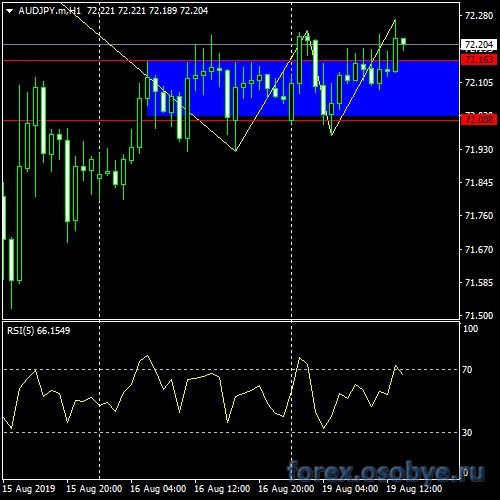 | ||
Сообщений: 239 |
August 19, 2019, the next market in the American open market session, this time I want to analyze the movement of the CADJPY pair at the H1 period. I used two horizontal lines and then made a blue area (see picture) to reference my open position, with prices 80.70 and 80.60. the blue area is a good area for me to open Sell positions, but now the price is too below the blue area, then I will make a pending order Sell limit in blue area around the price of 80.70-80.60 with stoploss 20-40pips 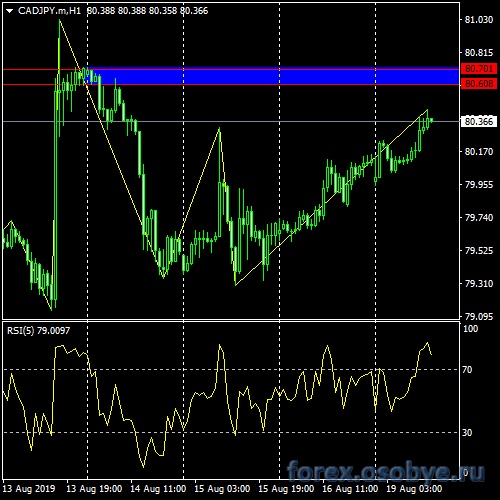 | ||
Сообщений: 239 |
August 19, 2019, following it in the American open market session, this time I want to analyze the movement of the EURAUD pair during the H1 period. I used two horizontal lines and then made a blue area (see picture) to reference my open position, with Prices 1.6407 and 1.6388. the blue area is a good area for me to open Buy positions, if it breaks below 1.6407-1.6388 I will open short positions  | ||
Сообщений: 239 |
August 19, 2019, This time the analysis is on the American open market session, on the NZDUSD currency pair during the H1 period. keep using two horizontal lines then I made the area colored blue (see picture) to reference my open position whether to sell or buy, with prices 0.6434 and 0.6423. in the blue area is the area to open the best position in my opinion. I will place a pending order in the blue area with stoploss around 20-40pips 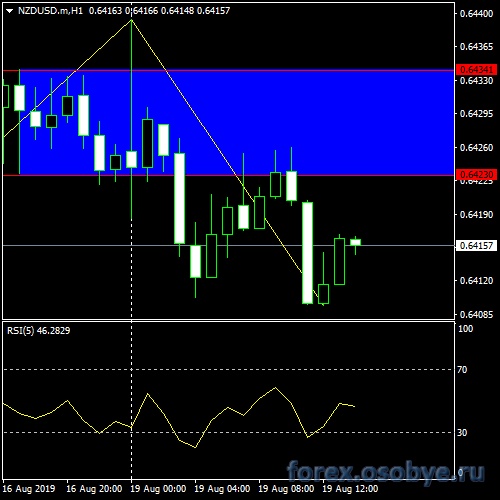 | ||
Сообщений: 239 |
August 19, 2019, the next market in the American open market session, this time I want to analyze the movement of the EURGBP pair in the H1 period. I used two horizontal lines and then made a blue area (see picture) to reference my open position, with prices 0.9194 and 0.9173. the blue area is a good area for me to open a Sell position, but now the price is too below the blue area, then I will make a pending order Sell limit in the blue area around the price of 0.9194 -0.9173, still maintaining financial management 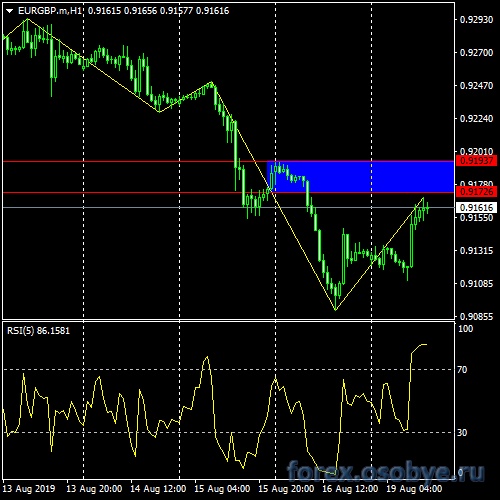 | ||
Сообщений: 239 |
20 August 2019, Hello friends, again this time I want to analyze the movement of the EURUSD pair on the H1 timeframe, using two horizontal lines and then making an area that is colored blue (see picture) to reference my open positions either sell or buy, there at Prices 1.1088 and 1.1083. the blue area becomes the area for open positions. this time I will focus on selling if viewed based on the blue area 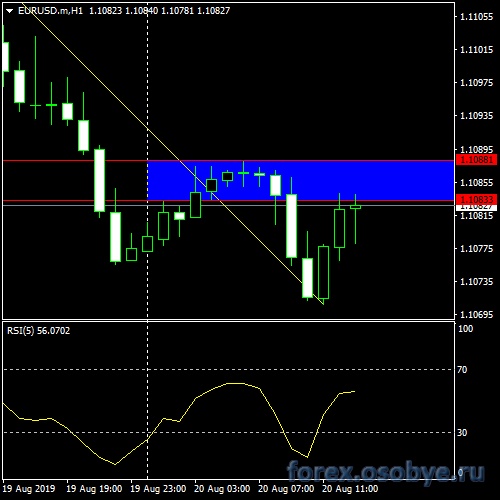 |
| В начало страницы |
Быстрый ответ
Чтобы писать на форуме, зарегистрируйтесь или авторизуйтесь.